Jeff Grobb, a famous American author, once said, “When given a choice between two, choose the third.” I think that in the design world, especially with the endless options of apps and websites, there are fourths, fifths, and many more possibilities. The process of narrowing them down is not easy and becomes even harder as we approach the final decision. The toughest moment is when we are left with the final two. This is where A/B testing comes into play.
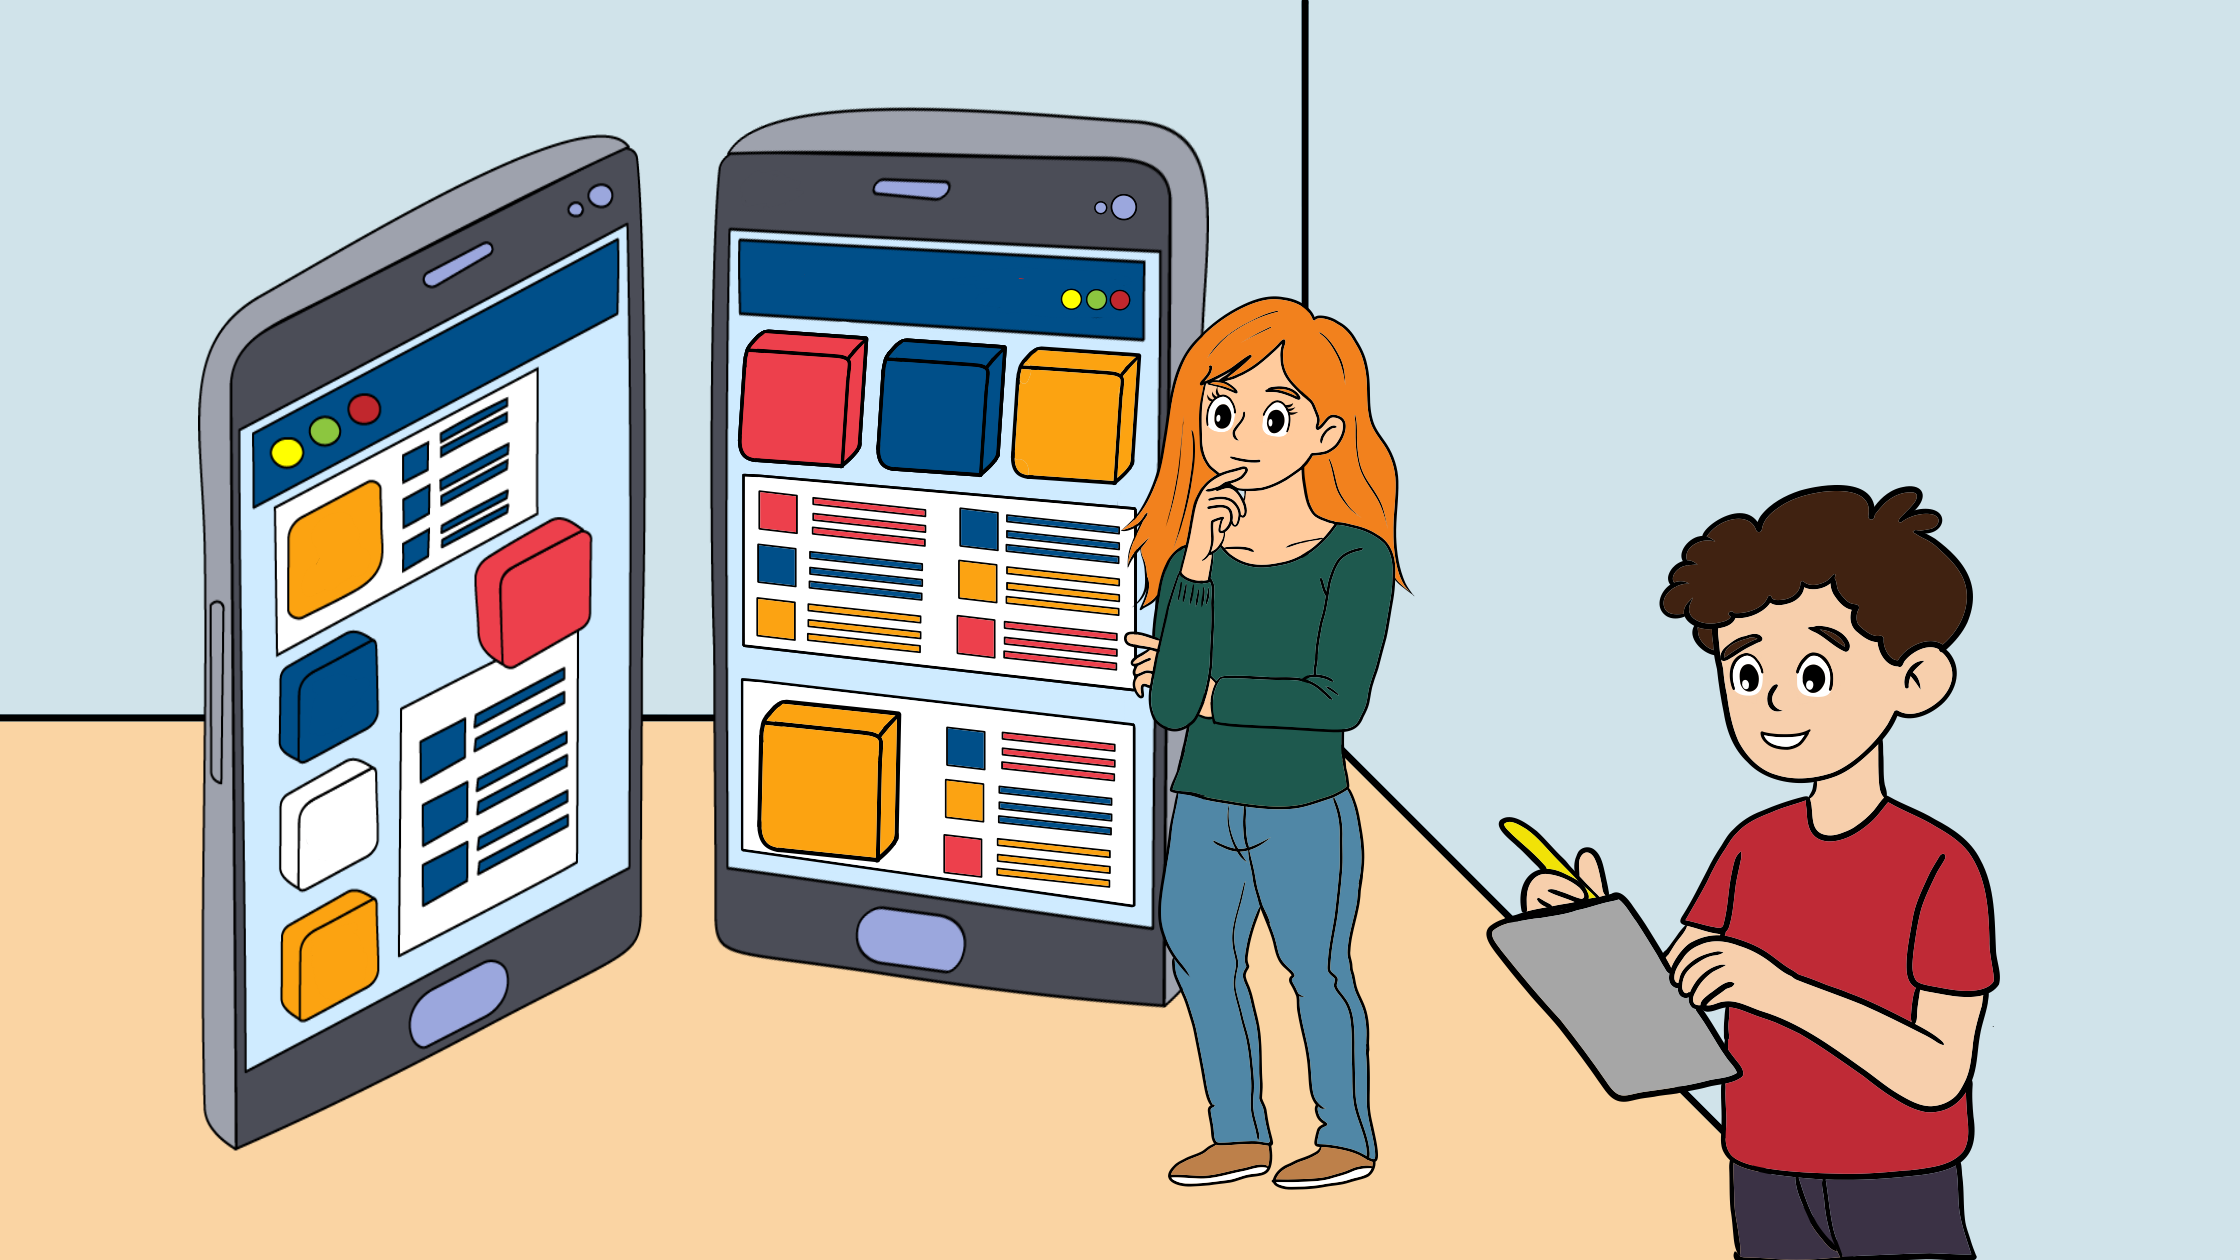
What is A/B Testing?
This is a quantitative research method that compares two or more design variations in front of a live audience to identify which performs best based on predefined business success metrics. In an A/B test, we create two or more variations of a design in a live product. Most commonly, we’ll compare the original design A, also called the control version, and one variation B, called the variant.
A/B Testing has applications across many fields, including marketing, social media, and retail. User researchers and designers mainly use it to test website and application designs.
When should we use A/B testing?
This research method can identify the user experience improvements that align most effectively with business goals. It is not suitable for assessing the qualitative aspects of user experience, such as satisfaction, understanding, and emotional response. It has a strict purpose.
For example, A/B testing can reveal that users spend more time on a page but cannot explain why they feel more engaged. When researchers want to understand the reasons behind user behavior, they need to use methods such as user interviews, usability testing, and surveys. These methods complement the quantitative data collected from A/B testing.
The steps for setting up an A/B test
Adopting these steps improves the likelihood of conducting a reliable, meaningful test that yields positive results.

1. Define the objectives and hypothesis
We begin by defining the problem or behavior to improve. Our goal should be specific, measurable, and aligned with a business or user objective. For example, instead of “improve the homepage,” we specify “increase newsletter sign-ups by 15%.” A clear objective keeps the test focused.
We also develop a testable hypothesis that predicts the outcome of a change. A strong hypothesis connects a design change to a predicted user response and explains the reasoning behind it. For example: “If we reduce required form fields from six to three, users will complete the form more often because it’s easier.” This guides and justifies our testing approach.

2. Identify key metrics
Here, we decide how to measure success. We select primary metrics (the main outcomes we want to improve, like conversion rate) and, if necessary, secondary metrics (such as time on page or engagement rate). The metrics must directly connect to our objective. We avoid tracking too many metrics, because this can make results confusing.

3. Create the variations
On this step, we need to create two versions: Version A (the control), which is the current design, and Version B (the variation), which features one intentional change based on our hypothesis. We modify only one key element at a time (e.g., button color, headline text, layout structure) so we can clearly identify what caused any difference in performance.

4. Segment and Randomize Users:
We need to define our target audience (e.g., new visitors, mobile users, returning customers). Later, we use a system that randomly assigns users to either Version A or Version B to eliminate bias. Randomization ensures that differences in results are due to the design change rather than external factors (e.g., age, technological knowledge).

5. Determine Test Duration and Sample Size:
We determine the appropriate test duration to gather sufficient data for reliable results. The test should include an adequate sample size to achieve statistical significance.

6. Launch and monitor the test
We activate the A/B test and ensure both versions work properly across devices and browsers. We monitor performance during the test to verify that there are no technical issues. We avoid making additional changes during the experiment to avoid compromising the validity of the results.

7. Analyze the results:
After gathering sufficient data, we compare the performance of both versions using our chosen metrics. We employ statistical analysis tools to determine if the differences are significant and not just due to random chance. We go beyond surface-level numbers and analyze user behavior patterns.

8. Implement and Document Findings
If Version B performs significantly better, we will implement it permanently. If results are inconclusive or Version A performs better, we document what was learned. Recording findings helps build long-term UX knowledge and informs future experiments.
What tools can be used to conduct A/B testing?
We can use various tools to set up design options and evaluate A/B testing results. Some of the most widely used tools are:
Google Optimize
Google’s enterprise A/B testing tool integrates with Google Analytics 360, enabling businesses to test webpage versions and assess performance against analytics goals. Its main advantage is seamless integration with Google’s tools, making it easy for teams familiar with Google products. However, it mainly focuses on website experiments and offers less flexibility for server-side or product testing than some competitors.
Optimizely
This platform enables product and marketing teams to test and optimize digital experiences through A/B testing, feature experiments, and gradual updates. It works at both the UI and server levels, enabling testing of design and complex functionalities. Organizations choose Optimizely for its scalability and flexibility across web, mobile, and backend systems, despite its higher cost and technical requirements.

Adobe target
Adobe Target is an enterprise-level testing platform in Adobe Experience Cloud, enabling A/B tests and personalized experiences using user data. It integrates seamlessly with Adobe Analytics and marketing tools, linking experiments with customer insights. It uses AI to find top content for audience segments. Ideal for large organizations using Adobe products, it combines experimentation with personalization but can be complex for new teams to set up and run.
Visual website optimizer
VWO is a website optimization platform combining A/B testing with tools like heatmaps, session recordings, and feedback. It helps companies test variations and understand user interactions, providing both quantitative and qualitative insights. VWO is user-friendly, ideal for website projects, but mainly focuses on website experimentation rather than backend or complex features.
Case study examples
HubSpot: Experimenting with email formats
This example demonstrates how basic elements such as text alignment can impact user engagement. HubSpot is a customer relationship management platform that conducted focused A/B testing involving their email campaign. The measurable outcome was the click-through rates on weekly subscriber emails. HubSpot suspected that email text alignment affected this outcome. They believed that changing the text alignment could enhance user experience and boost engagement.
HubSpot conducted an A/B test comparing two email formats: Version A (control), with centered text (standard), and Variant B, with left-justified text.
The experiment produced unexpected results. Despite the hypothesis, left-aligned emails performed worse than centered ones, with fewer clicks. Less than 25% of left-justified emails outperformed the control. This HubSpot A/B test highlights the importance of testing even minor details in email marketing, as audience preferences vary and assumptions can be wrong.


Going: A three-word tweak resulted in a triple-digit conversion boost:
“Going”, a travel company, struggled to convert visitors into premium subscribers. Their initial approach of offering a free, limited plan first didn’t effectively demonstrate the value of their premium options, resulting in low conversion rates. The “sign up for free” invitation was not well-received by the audience.
A suggestion to change the wording of the invite was tested using A/B testing. The results showed a preference for using “trial for free” over the original control, making the value clearer and more immediate.
The results of this change were impressive. The “Trial for free” version drove a 104% month-over-month increase in trial starts, boosting paid conversions and overtaking organic traffic for the first time. This A/B test success provided the company with valuable insights, helping them further improve their marketing strategies.


Mail.CZ: Using larger product images to improve revenue:
Mall.cz, an e-commerce enterprise in the Czech Republic, aimed to significantly increase its online sales. The company ran a test to compare different sizes of product images and descriptions. One variation of the product page featured large product images with descriptions directly beneath them (control). The suggested modification used much larger images, with descriptions only visible on mouseover. Results favored the latter, and with this modification, sales had increased by 9.46%.


Conclusion
In summary, A/B testing is a powerful and practical way to make data-driven design choices. When used correctly, it enables teams to go beyond assumptions and base improvements on measurable results.